TL;DR
I did my PhD thesis in the late 1990s, working with a significant system for processing unrestricted natural language text eg. in newspaper articles and more, and reasoning about the information contained. We tested this system via the international Sixth Message Understanding Conference (MUC-6) in late 1995. This involved running the system on four tasks of varying complexity over 100 articles from the Wall Street Journal. Our system was one of only six world-wide which attempted all four tasks. My eventual thesis work was firstly a post mortem of our performance, secondly a wider look at “evaluation” of such NL systems.
After completing my thesis (and passing), I could have gone on to do other work in mainstream NLP, but I chose not to. Why not?
Because, as my thesis developed, it seemed clear to me that the prevailing direction was somewhat misguided. It seemed like contemporary work was more about happily building things to push off a cliff, and hoping it flew a bit further than before, rather than a conscientious attempt to address the deeper issues in a more scientific way. My view is that we are necessarily building an imperfect approximation to a very complex problem, and we need these tools to be reliable and useful in a way we can predict, and should proceed accordingly – like taking reliability as fundamental and working backwards from there – not just assuming or hoping we’ll get “good enough” in time.
Repeatedly adding yet more epicycles with diminishing returns to try to fix a questionable approach, maybe to hit some ceiling some way below acceptable on serious tasks, that didn’t appeal to me. It was past time to look for alternatives beyond this geocentric model (check your history here). And yes, I did start to look at alternatives, partly involving the kinds of language used in mathematical proofs. I’ll explain more at a later date.
What delights are in my thesis, should you care to take a look? See this page for PDFs.
- explains the main components of our system, at the time one of the most complicated and ambitious ones around (you could even hold a sensible conversation with it)
- detailed walkthrough of task output for one article, both the correct bits and the errors, showing the kinds of inference needed and the various things which could go wrong – and how hard it was to trace that information
- tools and techniques for comprehending task performance across systems, so seeing which parts of the tasks were achieved by most systems vs which were only achieved by a few systems or none at all (this kind of detailed cross-system analysis still seems rare – yet it’s far more informative than collapsing results to a few numbers and comparing those numbers)
- detailed look at the evaluation framework and task spec for MUC-6
- start to look at assessment and “evaluation” in the context of NL systems NOT being a magic black box but being systems of a particular type and construction, an imperfect approximation to a very complex problem, which has a very real effect on how we try to use them and understand their strengths and weaknesses. I certainly didn’t see anyone taking this route in contemporary work on evaluation.
I’ll now expand on some of these points.
Background
I did my PhD in the mid 1990s as part of a research group in Durham who were building (at the time) one of the most complex systems for handling natural language (NL) text and reasoning about it. I don’t believe there were many systems at the time with the same potential functionality and depth of ambition, and not many which were entirely a research project in a university. Most similar work at the time was inherently symbolic – manipulating explicit structures – and techniques from connectionism were still being developed.
The Durham system was able to parse unrestricted text, build a syntactic representation, convert it into a “semantic graph” and integrate new information with its larger knowledge graph, then reason about the information and then output its conclusions in natural language. It was partly a toolkit for building specific applications, and we had several applications under development and research, including one which was effectively an independent conversational agent. Yes, you could carry on a reasonable conversation with it. It was fun and interesting to work on the system. I also learnt a lot from the others in the research group.
One significant application was in extracting important information from newspaper and financial articles, and to test this further, we entered (D)ARPA’s sixth Message Understanding Conference in 1995, henceforth MUC-6. MUC-6 was a test of information extraction, the final version testing aspects like Named Entity, Coreference, and filling of Scenario Templates to give a high-level summary of some financial article. Full info on the framework, task specifications and competitor reports can be found at https://aclanthology.org/volumes/M95-1/. Our system was one of only six worldwide who (publicly) participated in all sections of MUC-6.
One very important point about the group’s direction was that we were very much interested in developing useful and powerful tools that did particular tasks well, and not particularly tied to any theory or paradigm. We’d try out techniques if they seemed relevant and useful.
The term Natural Language Engineering was used in preference to older labels like Natural Language Processing or even Natural Language Understanding or even “Artificial Intelligence”. One part of our research was aiming to move such activities to a stronger footing, say moving from experimental systems towards more serious tools with predictive theories about their usefulness and limitations.
I quite like this quote from Deng Xiaoping in 1962: “It doesn’t matter if a cat is black or white, as long as it catches mice.” It appears near the start of my thesis, but it reflects our ethos.
Now, how successful we were at catching mice, that’s a question we needed to answer, and the MUC-6 work plus my thesis were steps towards trying to answer this.
My eventual PhD topic was directly a post-mortem on our system’s performance in MUC-6. It didn’t start that way, and I did experiment with other directions along the way, but the question of decent assessment (or evaluation) and wider issues is an important topic, and deserved much more attention. (I’d even say, it’s the most important topic if you are really serious about the science. Else you’re just building artefacts and hoping you get somewhere.)
The thesis covered various things: (a) description of the system architecture and the changes for MUC-6; (b) a detailed worked example showing how our system calculated the full output for one particular article over all four tasks, both the correct bits and the incorrect bits; (c) a deeper analysis of how all systems did on the tasks, looking at how often several systems agreed and where they disagreed; (d) a deep look at the MUC-6 tasks and framework; then (e) a wider look at important issues and limits for evaluation of NL systems.
You can read the thesis via the University of Durham’s website, see https://etheses.dur.ac.uk/5024/ (scanned from the original print version…) – or a shorter PDF on my blog site via https://free-variable.org/2013/01/31/my-phd-thesis-is-15-years-old/.
About the acronym of the system: it wasn’t my choice, and that decision was made some time before I joined that research group, and an older and wiser me would have hesitated.
Part one: cross-system analyses
The bit I want to highlight first is my work on qualitative comparisons of the outputs of various systems. We all had access to all of the answers generated by each competing system in MUC-6, and to the human-produced answers used in scoring. Official scoring basically compared each output to the answers to produce scores for each system. Those scores were mainly the conventional notions of precision and recall (ratio of correct cases to all retrieved, vs ratio of correct cases to all relevant), sometimes condensed to an f-score (2 * precision * recall / (precision + recall)). We could then compare the precision and recall scores of the systems in a table for each task, aggregated over 100 articles from the Wall Street Journal.
What I did is look at how the different systems got their scores, and whether there were patterns to this. For example, two systems might get a final f-score of 70%, but that does not mean they produced the same output! It’s quite possible that qualitative differences exist between how they get the scores. I wrote a tool which aggregated the system outputs against each other and the answers, displayed the output and then derived various scores across the comparisons. Here’s an example of comparison output:
<organization-2> :=
  a {ORGANIZATION-96302}
  b {ORGANIZATION-1}
  c {ORGANIZATION-1}
## ORG_ALIAS: Merrill Lynch
     == b
     -- a c
## ORG.DESCRIPTOR: a unit of Merrill Lynch & Co
     == a
     -- b c
   ORG_NAME: Merrill Lynch Canada Inc
   ORG_TYPE: COMPANY
Basically, it says three systems identified this entity, getting the main name and type correct, but two systems (a & c) failed to identify an alias and two systems (b & c) missed the descriptor. From this output, you can start looking at what most systems got right, and at what most systems got wrong, and if there are patterns to this. It was quite interesting to see which parts many systems got right, and which parts most (or all) systems struggled with.
I tried graphing the information from this analysis in various ways. The most interesting way was looking at relative frequencies in classes of how many systems were correct on any scoring feature – for example, how many features where NO systems were correct, how many for ONE system, … how many for ALL systems? Here’s the graph for one task, Scenario Templates.
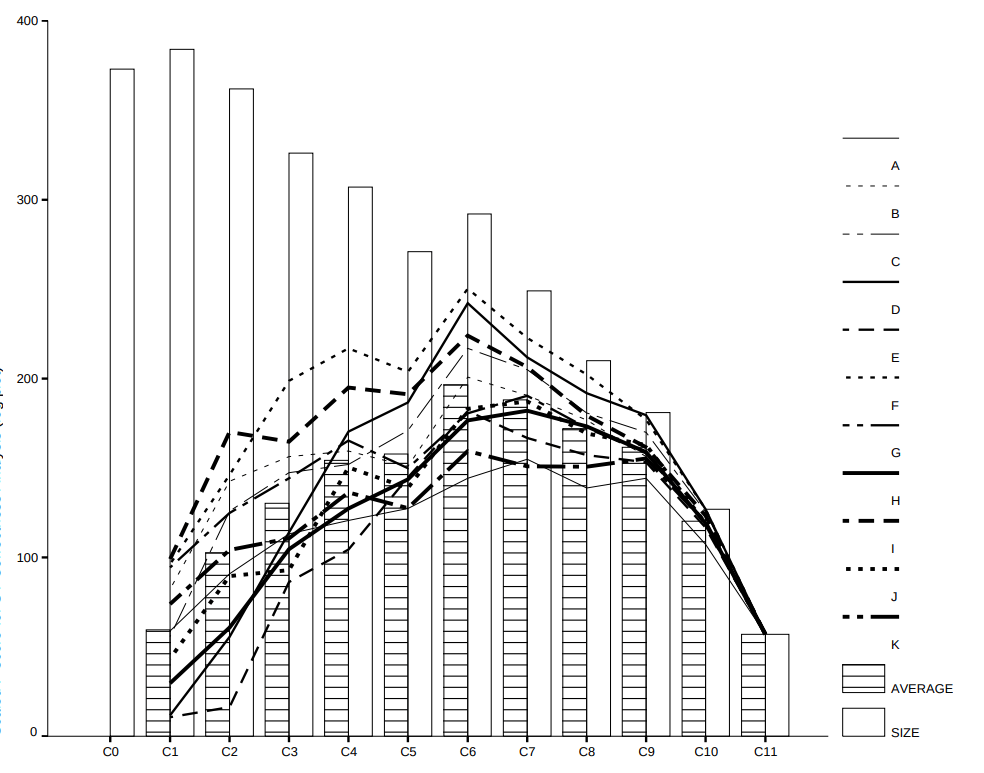
The most interesting bit is the pattern of the white bars, which are the counts in each category of N systems getting that feature correct. With eleven systems competing on this task, the classes range from C0 (no system correct) to C11 (all systems correct). In this task, there are relatively few features in C11 (that all of the competitors get right – around 60), vs many more features in C0, C1, C2, C3 (over 300 each) where no systems or few systems got those answers right. There’s also a rising trend as we go from C11 to C0. Basically, this task was challenging for existing systems. The lines across the bars represent how each system did, showing how well it did within each of the classes, eg system F was frequently the best performing in each grouping since its graph is near the top. Our system was system A.
The graph below for Named Entity (NE) is very different – a very high number of features which most systems get correct, and very few features which no systems or only a handful get correct. Notice also it’s a log plot, because the numbers of cases which most systems get correct is so high. There were 18 competitors, hence classes range from C0 to C18. The overall profile of white bars (number correct in each class) is completely different from the Scenario Templates (ST) task. This suggests a big difference in task difficulty, and that the Scenario Template task was better at putting distance between the systems.
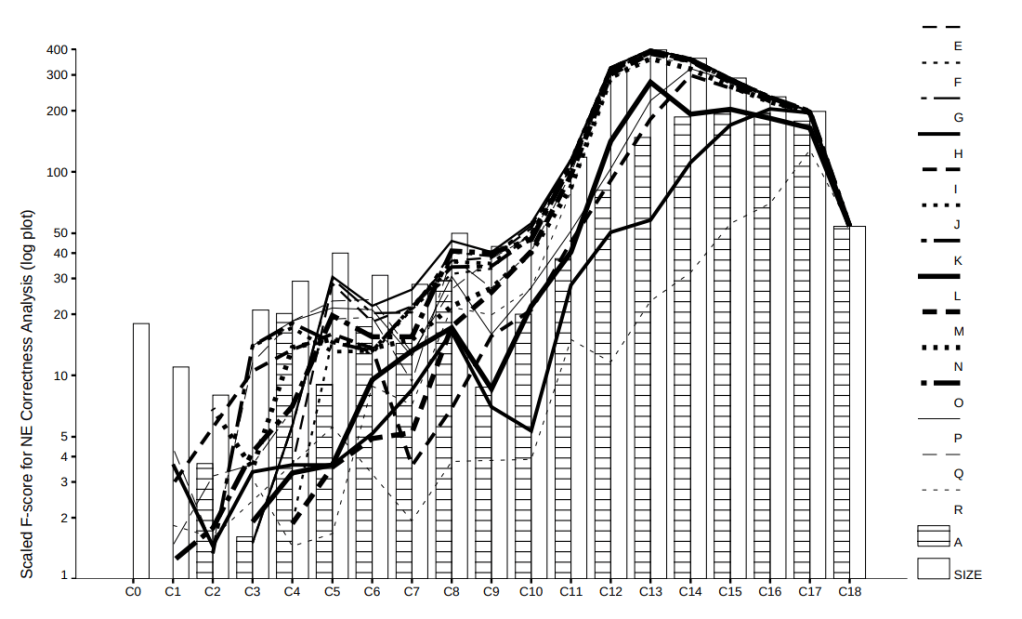
Alternatively, I suggest there was quite a lot of low-hanging fruit in the NE task, features which were possible to get right with relatively simple processing, and ST was much more challenging, not so amenable to simpler techniques.
CAVEAT: this kind of analysis of correctness does NOT reflect the imprecision or over-generation on tasks, which is also a big part of system performance. It’s clearly unhelpful, sometimes even dangerous, if a system suggests answers which are irrelevant or misleading. But I never found a satisfactory way to incorporate that in the above graphs, so bear in mind that these graphs aren’t a full picture of system performance.
I also tried to graph out some statistics from similarity of systems, to see whether there was a pattern of two systems producing similar results across big parts of the tasks. This one’s less interesting, less conclusive. Section 5.7 of my thesis, if you want more info.
Anecdotally, from reviewing the detailed output comparisons and the resulting graphs, we saw that the Durham system often got wrong some things that many other systems got right, but our system was able to get right some things that few other systems did. That is, we didn’t start bad and get worse, but started bad and recovered a little – albeit with some over-generation too. This wasn’t unexpected given our different and more complex approach.
Some of the simple errors were also feasible to address with a few more cases in the code, and we did do some of these fixes later. After these and some related work and preparation for the subsequent MUC-7 event, we did rerun the test set and re-score a few months afterwards. The overall scores did go up slightly, but looking at the detail, we had some scores GO UP nicely for some articles, yet scores also DROP on other articles. It was far from uniform, and hard to predict. See the numbered arrows going everywhere on the graph below.
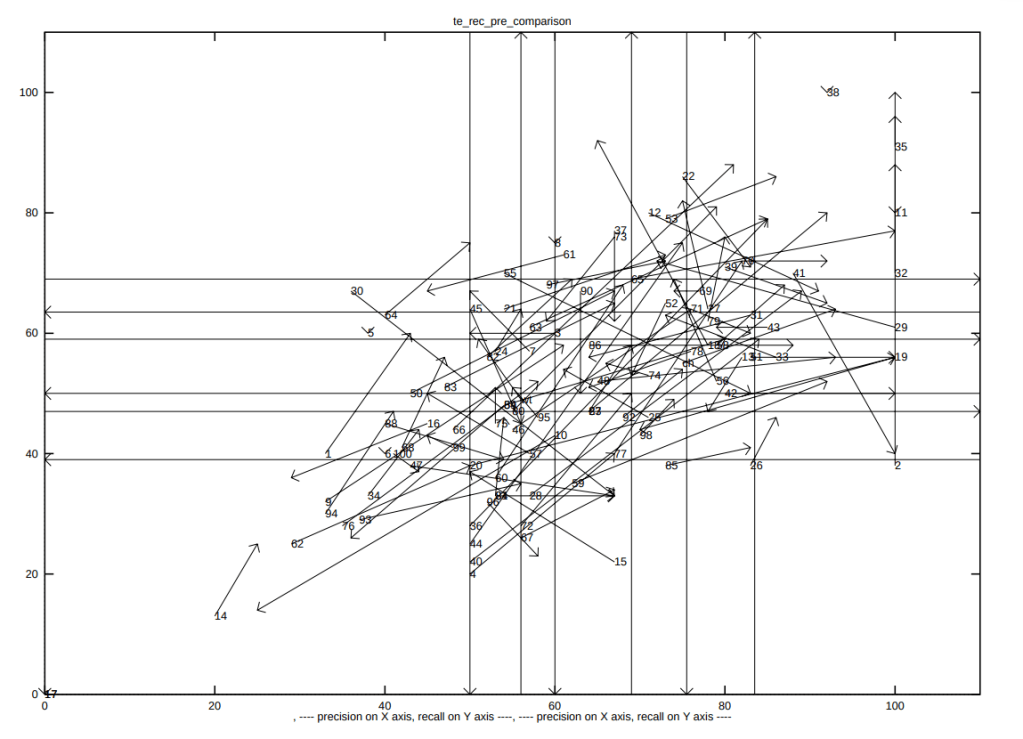
This graph shows changes in precision (horizontal) and recall (vertical) for the 100 article on the Template Elements task. The numbered arrows show the original score to revised score for the article of that number. For example 14 at bottom left went from ~20 precision to ~25 precision, and from ~15 recall to ~25 recall – a slight improvement in both. Article 61 to the top and centre dropped a lot of precision and a fair bit of precision. Also note the cases trading precision for recall, eg. higher precision but lower recall – all the lines with negative gradient!
The lack of consistency is a very important point. Just because the overall score goes up, doesn’t mean there’s a uniform improvement. Quite often, it’s two steps forward and one step backwards for most things, possibly more dramatic for some cases. That’s why it’s so important to look into the patterns behind the headline numbers, especially if you want to understand how well your approximation is performing.
Part two: what do headline scores actually mean?
Just because we can compute the numbers onto a 0-100 scale, it doesn’t mean that the resulting number is particularly meaningful in a wider context, and certainly does not mean that absolute ranking of these numbers represents anything significant, especially in the sense of useful predictions. It could even be harmful. Just like blindly calculating the average on a set of numbers where it’s not appropriate to do so – it looks respectable but isn’t sound for further inference.
The classic “Numerical Recipes” by Press, Teukolsky, Vetterling and Flannery has wise words on this in a relevant chapter: “Data consist of numbers, of course. But these numbers are fed into the computer, not produced by it. These are numbers to be treated with considerable respect, never to be tampered with, nor subjected to a numerical process whose character you do not completely understand.” There are other wise nuggets throughout this book, not just the equations and the code.
In general, the more richness and structure we can maintain from the original data, the better, and be cautious about collapsing that structure in ways that can be mis-interpreted (by us or by others).
So I suggest, in general, there’s certainly room and benefit for showing more detail than just a table of final “eval” percentages. There is so much more info that would help to understand the strengths and weaknesses of different systems, particularly to see if they are all pretty much doing the same thing, or whether some differ in interesting ways. With such complex approximations to a hard problem, the more detail, the better.
We should also be careful how we interpret “eval scores”.
First, there’s the question of whether each part of a task should have equal value. Standard frameworks for such “evaluations” generally give equal weighting to features in a task, and this is rather artificial when it comes to serious applications. Clearly, extracting a key bit of info about change in a company’s management structure matters much more than identifying details about minor actors in the story, eg. because the former could make a big difference in some financial decision, whereas the latter will have little or no bearing. We should put more weight on the elements which really matter.
Without awareness of relative importance, we could be giving too much reward for simple things and congratulating ourselves prematurely on “progress”. What does an “80% score” mean? That we’re 80% of the way to a complete solution? Certainly not. To me, 80% usually represents that we can do the very easy stuff, maybe some of the middle stuff with a bit of tuning and heuristics and luck, but it says nothing about whether we have a clear path to doing the hard bits in the remaining 20%. That’s the impression I got from looking at comparisons of actual system output. If we don’t have a good chance to get the remaining 20%, especially when the important parts of the task are in that 20%, then morally the reported score should be much lower.
What about the starting point? It’s worth considering how far we can get on some task using the simplest of techniques, and taking this as a baseline. Then we can consider what our more complicated techniques give us beyond this baseline (and whether the extra effort is worth it). I expect we can get a modest score in Named Entity (NE) by wrapping up some regular expression matching with a few heuristics. Let’s say that got 60% in conventional scoring. So a system score of 80% would only be adding ~20% to the baseline. We’re not starting from sea level, maybe going slightly beyond the base camp and stopping far short of the summit.
Nor should we imagine that progress on the 0-100 scale will be linear. Going from 80 to 90 will be much (much) harder than from 60 to 70. You might have noticed progress graphs rising logarithmically, initially fast rises but later slowing down – and typically heading for some ceiling. And the idea that we can feasibly get 100% on such a complex problem is a bit of 1950s conceit, and ripe for a rethink.
Suppose we just got 80%. What do we do next? We can maybe tinker some more and get 85%, maybe some more and claw up a few more percent. But would this give solid progress towards the things that really matter? Will it scale to capturing the really important things that are beyond simple techniques? The parts of the task where the real value lies? I’d argue not (and I saw this when looking at comparisons across systems). I think we’d be in a loop of adding further epicycles to try to claw up a few more percent, but it would get increasingly hard to get closer to that ceiling.
Part three: what are we actually trying to do?
The later part of my thesis considers wider issues of “evaluation” of these kinds of system. There’s a survey of relevant literature, a detailed look at the MUC-6 framework, then an attempt to add some new ideas to the discussion.
To be blunt, NL systems are not magic. They should not be approached as black boxes. We should be clear about what NL systems actually are, how they work, and orient our work towards this if we want useful and reliable tools. The key point is this:
NL systems are inherently a limited approximation to some complex NL task.
Let’s break this down. In general, NL tasks are complex problems. Hard to pin down, and using many different kinds of knowledge and skills. Establishing criteria for completion is also hard – it’s not like there’s a useful decision process like whether you have a winning position in a board game, or having a candidate proof script get accepted by a proof checker.
By limited approximation, I mean that we’re trying to build something which produces useful behaviour using the resources available, say with certain run times or hardware limits, and within the techniques and knowledge available at the time. Some systems are a complex pile of rules, with various dependencies. Some may have their rules chosen to reflect a certain approach, eg. syntax trees and graph semantics. The performance depends on various things, like how well the approach matches the task, and how complete and error-free the rules are.
One consequence of this view: what we should ask for is some meaningful indication of how well this approximation matches the intended task. That’s really what we should aim for in “evaluation”, and answering it well is where the science comes in.
I’m very wary of the word “evaluation” now. It has been misused over the years, a bit like other phrases in the field, creeping like the Overton window, and used to cover a range of approaches of varying quality. Being strict, evaluation should be about calculation of exact answers. The word “assessment” is more accurate, and is about estimating some quantity from a sample of inputs. It is (or was) the term preferred by speech processing researchers, certainly circa 1995, and I think this reflects the relative maturity of their methodological framework.
Do we evaluate students when they take their exams? No, we give test a sample of their knowledge by some (hopefully) representative sample of questions, or set some coursework, and make a judgement based on their response to those questions and coursework tasks. It’s no accident that the word “assessment” is used here. We’re assessing the level of a student’s knowledge and ability through a sample of work, and making an assumption that results on this is a reflection of their general ability. Most of the time, this is a fair assumption, though clever question spotting can sometimes help a student get a higher grade, and poor exam technique can let other students down. It’s impractical to evaluate a student’s abilities in more depth, and this finite sampling via assessment gives results which are generally good enough for the intended purpose.
Of course, it would be great to improve on this process where students are concerned. Determining a final grade shouldn’t be the key objective, however. What is more important is understanding a student’s strengths and identifying where help is needed in the less strong areas.
Likewise, it impractical to evaluate an NL system’s whole performance. We can try to assess performance based on a sample of inputs. But the performance of an NL system is less “smooth” than a student, and we can’t always assume that the results on a sample of inputs is representative of wider performance. Given the nature of most NL systems, effectively a complex set of rules, performance over the whole space could actually be quite jagged, eg. due to missing rules, errors in rules, conflicts, …
So what does a percentage number from this kind of sampling tell us? Only what how the system in its current configuration performed on this set of examples. It’s more of an anecdote than anything with useful predictive force.
Compare it to a bridge. You’d hope that a bridge is strong everywhere. Professional engineers build bridges that we can rely on and don’t have to worry about using. But NL systems are more like bridges with lots of gaps and weak bits. And how do you find these out? At the moment, lots of checking. Maybe “evaluation” gives you some weak estimate of your success to make it to the other side, but not much more than that. Person X making it to the other side doesn’t say much about whether person Y will make it too.
Understanding the strengths and limitations of the approximation, and how best to use it in serious tools (especially if outcomes matter), is where the science and serious engineering comes in. A collection of rules with limited testing and hard-to-predict behaviour is an artefact, a thing, a Heath Robinson (or Rube Goldberg) machine, not necessarily a useful tool – and I include Durham’s system in that criticism.
Obviously, this improved understanding is much harder to do. It’s reassuring to measure easy things and come up with a number, and numbers are good for headlines, but we can and must do better, especially when errors have real consequences.
Part four: wrong end of the telescope?
But – I think we’re looking through the wrong end of the telescope.
Looking at the raw output from different systems in MUC-6, and seeing what’s required to fill the gaps, I was (and remain) sceptical 100% is an achievable target. It seems more likely that we’re facing more work with diminishing returns, and in the long run I expect (useful) performance measures to get stuck at some point under 100%. With incremental changes, there won’t be a time where we can guarantee acceptable performance on all inputs. There will be a ceiling, and always some cases where we’ll get incorrect or misleading results (and quite often, we won’t know where the errors are unless we check independently with some reliable process – and getting a system to mark its own homework doesn’t count).
So are we hill-climbing to a local maximum, with no plan for when we reach the sub-optimal top?
I mentioned the case of students earlier, suggesting that assessment was much more useful as a diagnostic tool to identify strong areas vs areas where further help was needed, and being sceptical about reducing the process down to rank-able numbers. I think NL system assessment should be oriented this way too – with focus on a diagnostic tool to understand the strengths and weaknesses of their implemented approximation to a task, and don’t pretend that the headline numbers mean so much.
Going a bit further, how about we stop pushing things off a cliff and hoping it will go further, and instead work with the inherent limitations of implementing an approximation to a complex problem to engineer something we can be more certain of?
A good friend & former colleague (Conor McBride) explains certain topics in programming as “trying to put the toothpaste back in the tube”. That is, attempting a complex process to recover information and structure that you’ve lost by rushing to a too-simple solution, when it was possible to work within the richer context and not lose that information in the first place. Similarly with NL applications, it can be very hard to check outputs or justify them (it took me ages to reverse engineer the behaviour in chapter 4 of my thesis – the worked example). Or in coding, if we reduce some decision down to a true / false flag, then we lose the info about why it should be true or false and can’t use that knowledge to simplify the code. (There are stronger programming languages that allow you to work directly with the why.)
The point is, we should work with the difficulties and inherent limitations from the start, and produce applications that make clear the limits and uncertainties as a fundamental part of their operation. Compare these scenarios:
- a conventional (“traditional”) system that works in X% of cases and you don’t know which of the (100-X)% is failing without extra checking or a lot of other work; or
- a system which only works for (maybe) fewer cases but clearly shows which outputs are reliable vs which ones need other help or checking.
Arguably, the latter is much safer for serious use.
Yes it will be much more complex, and much more work is needed.
But I think if we want reliable NL applications, we need to start thinking in these terms and start work on them. We need to move away from the current mode of pushing artefacts off cliffs, and start leaning into limits of the approximations.
Left somewhat shocked by the realisation of the state of the field back then, and not wanting a future of adding epicycles, I started to look at other options.
Briefly then. I was a post doc on a project looking at the kinds of language used in mathematical texts. I learnt a lot about advanced logics like dependent types and their application to programming. I wrote my own version of a proof checker, similar to what Lean does now, though more flexible and open ended, and used it in some experiments. One looked at using the checker component as the core of a system, using informal (weak) natural language manipulation to drive the proof checker. Some of these ideas are a good starting point. I’ll write more about this later.

